Departments / Sales & Marketing

Sales & Marketing

Revenue, rep and region performance, customers going quiet.

This department's pain

Sound familiar?

  • Who sold how much — every rep has their own spreadsheet.
  • Which region fell behind only becomes clear at month-end.
  • Nobody notices a customer going quiet; you find out once you have lost them.
  • Which customer is genuinely profitable and which is merely high-volume is anyone's guess.

Sales & Marketing department

What does ATLAS read?

Sales invoices, customer accounts, rep and region definitions, product price lists and sales targets.

Data entry

What does ATLAS make easier?

Visit and order entry from a phone for field reps. The visit is not transcribed into a spreadsheet in the evening — it is recorded on the spot.

Metrics it tracks

What does it look at in this department?

Sample questions

What does this department's manager ask ATLAS?

No spreadsheets, no formulas, no report requests — you write it exactly as you would say it.

“Who are my five most profitable customers this year?”
“Which rep is below target?”
“Which customers have not ordered in three months?”
“In which region is revenue falling?”
Early warning

It tells you before you ask

ATLAS: Customer 18 has been quiet for eight months — they were 6% of your revenue last year.
← All departments
Screenshot

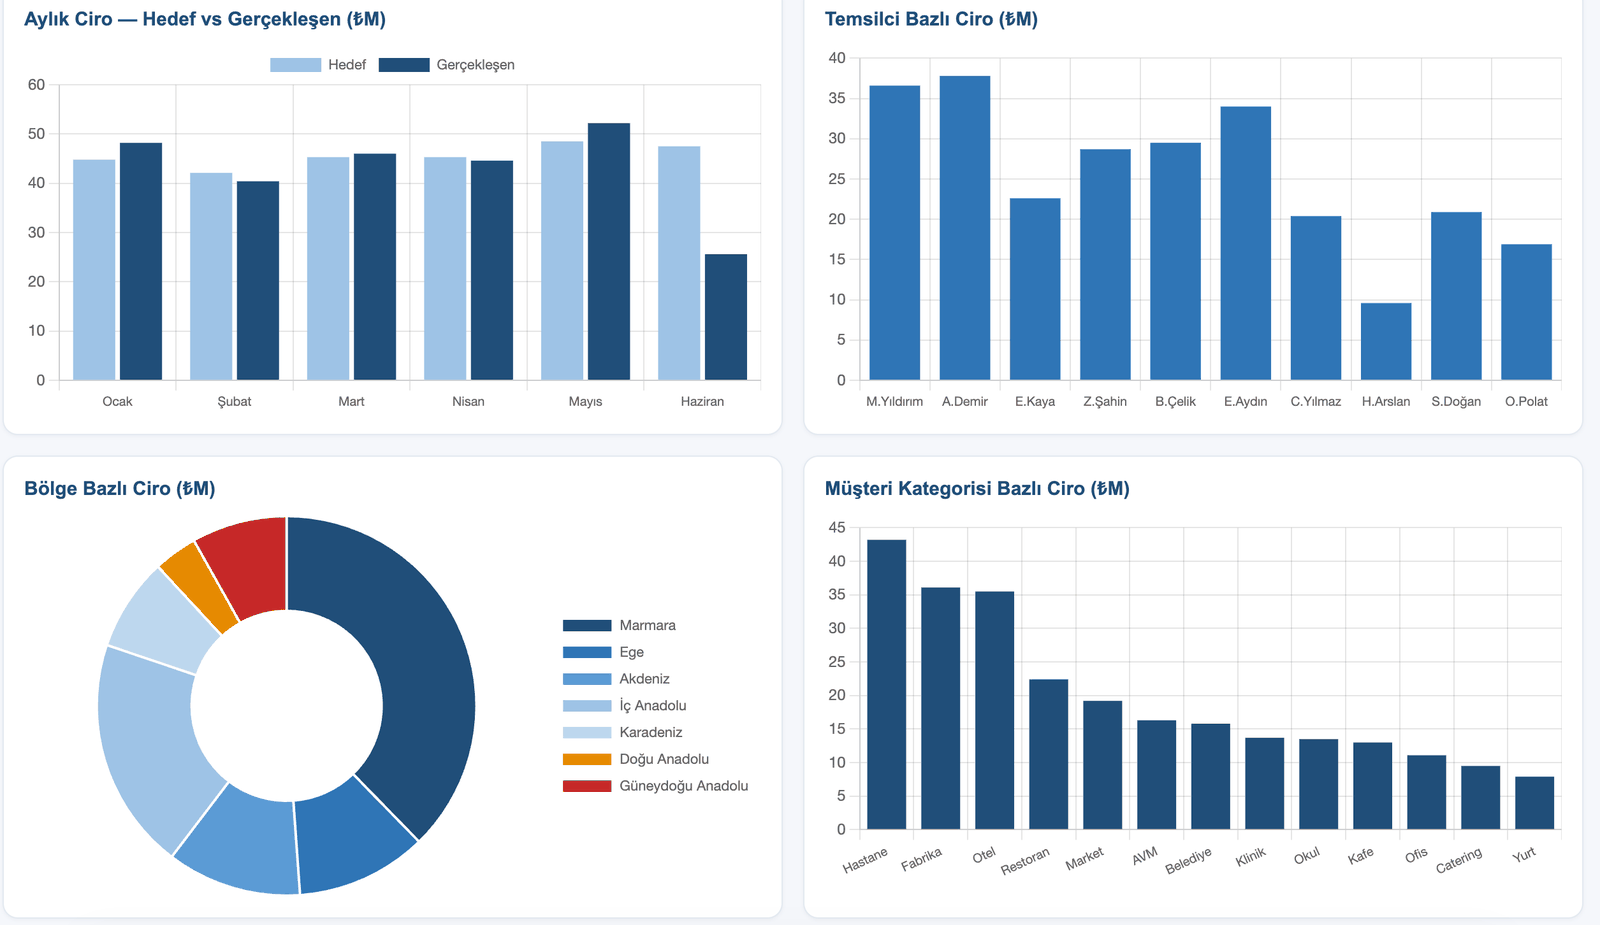
Sales & Marketing dashboard

The dashboard below was produced from the real data of the PÜRSU Paper case study.

ATLAS Sales & Marketing dashboard — KPI cards and charts
Target vs. actual comparison, status labels (On Target / Watch / Off Target) and trend charts.

See your sales department in ATLAS.

In the demo call we work with this department's own data.

Request a live demo