Departments / Production

Production

Net output, waste rate, capacity utilisation, downtime.

This department's pain

Sound familiar?

  • How much waste? Nobody can say exactly — it is estimated.
  • Which line is inefficient and which product eats time is known by instinct, not from data.
  • What is in the shift log reaches the spreadsheet weeks later — or never.
  • Downtime reasons are not recorded, so the same fault recurs every month.

Production department

What does ATLAS read?

Production records, waste records, line and product definitions, capacity data and quality acceptance results.

Data entry

What does ATLAS make easier?

A tablet instead of the shift log. The operator enters output, waste and downtime at the head of the line. In most companies this is the pilot department.

Metrics it tracks

What does it look at in this department?

Sample questions

What does this department's manager ask ATLAS?

No spreadsheets, no formulas, no report requests — you write it exactly as you would say it.

“Which line's waste has gone up?”
“What percentage of my capacity did I use?”
“Which is my least efficient product?”
“What was our most common downtime reason last month?”
Early warning

It tells you before you ask

ATLAS: The waste limit is under pressure — line 3 has been over the threshold for the last two weeks.
← All departments
The operator enters it at the head of the line; the record reaches the centre in the same second.
Screenshot

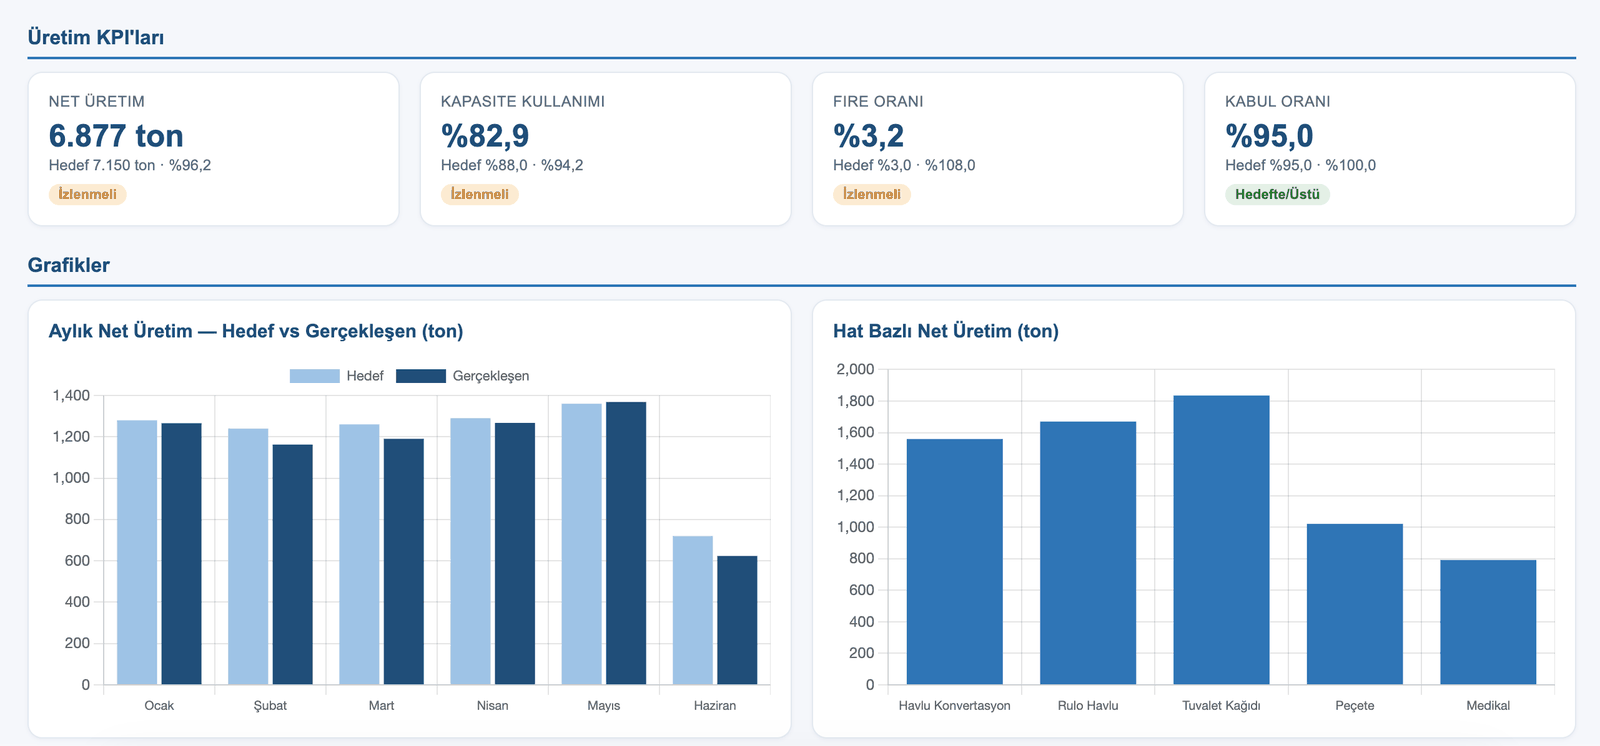
Production dashboard

The dashboard below was produced from the real data of the PÜRSU Paper case study.

ATLAS Production dashboard — KPI cards and charts
Target vs. actual comparison, status labels (On Target / Watch / Off Target) and trend charts.

See your production department in ATLAS.

In the demo call we work with this department's own data.

Request a live demo