Departments / Executive Management

Executive Management

Target vs. actual, department health score, risky-month detection.

This department's pain

Sound familiar?

  • Every department sends its own report; all in different formats, all late.
  • You cannot tell how the business is doing until the month is closed.
  • Departments blame each other and nobody knows whose number is right.
  • By the time you notice a problem it has usually already happened.

Executive Management department

What does ATLAS read?

Data from every department: sales, production, collections, logistics, procurement, HR and quality. It compares target files against actual figures.

Data entry

What does ATLAS make easier?

Management does not need a separate entry screen — the data entered by the other departments feeds the executive dashboard directly.

Metrics it tracks

What does it look at in this department?

Sample questions

What does this department's manager ask ATLAS?

No spreadsheets, no formulas, no report requests — you write it exactly as you would say it.

“Which department is doing worst this month?”
“Where are we against target?”
“What got worse compared with last quarter?”
“Which was my most profitable month this year?”
Early warning

It tells you before you ask

ATLAS: Revenue is on target but collections are slipping — a cash squeeze is coming.
← All departments
Screenshot

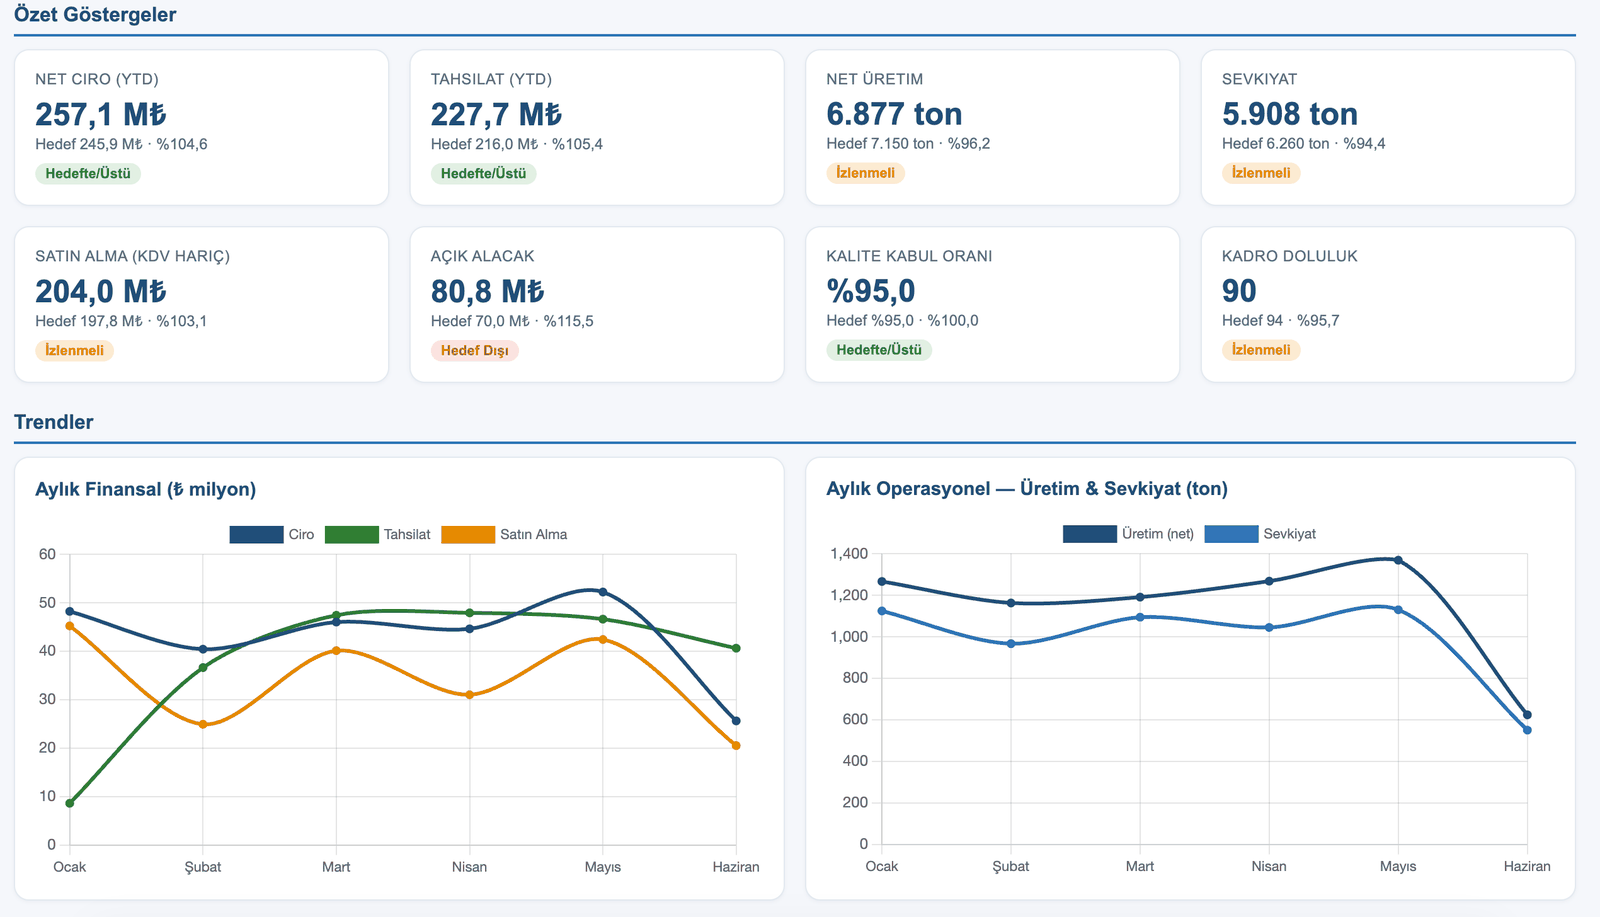
Executive Management dashboard

The dashboard below was produced from the real data of the PÜRSU Paper case study.

ATLAS Executive Management dashboard — KPI cards and charts
Target vs. actual comparison, status labels (On Target / Watch / Off Target) and trend charts.

See your executive management department in ATLAS.

In the demo call we work with this department's own data.

Request a live demo